Newsletter #12 | January 30, 2025
Facilities managers and building operators face critical questions daily: Is our air quality actually improving, or are we investing in HVAC modernization without clear evidence? Which rooms have persistent ventilation problems? Are filter replacements on schedule actually making a difference? Should we upgrade systems in specific zones?
In client projects, we often see a common challenge: facilities teams have monitoring data but struggle to understand what's actually happening in their buildings, and more importantly, what to do about it.
The challenge lies in understanding what measurements actually mean: how CO₂ levels shift during peak occupancy, whether PM2.5 spikes correlate with outdoor pollution events, or if recent filter replacements made measurable improvements. Without this clarity, it's impossible to distinguish between problems requiring capital investment such as HVAC upgrades and issues solved through simple operational changes like adjusting ventilation schedules or closing windows during pollution episodes. That's exactly why the Reports Module exists.
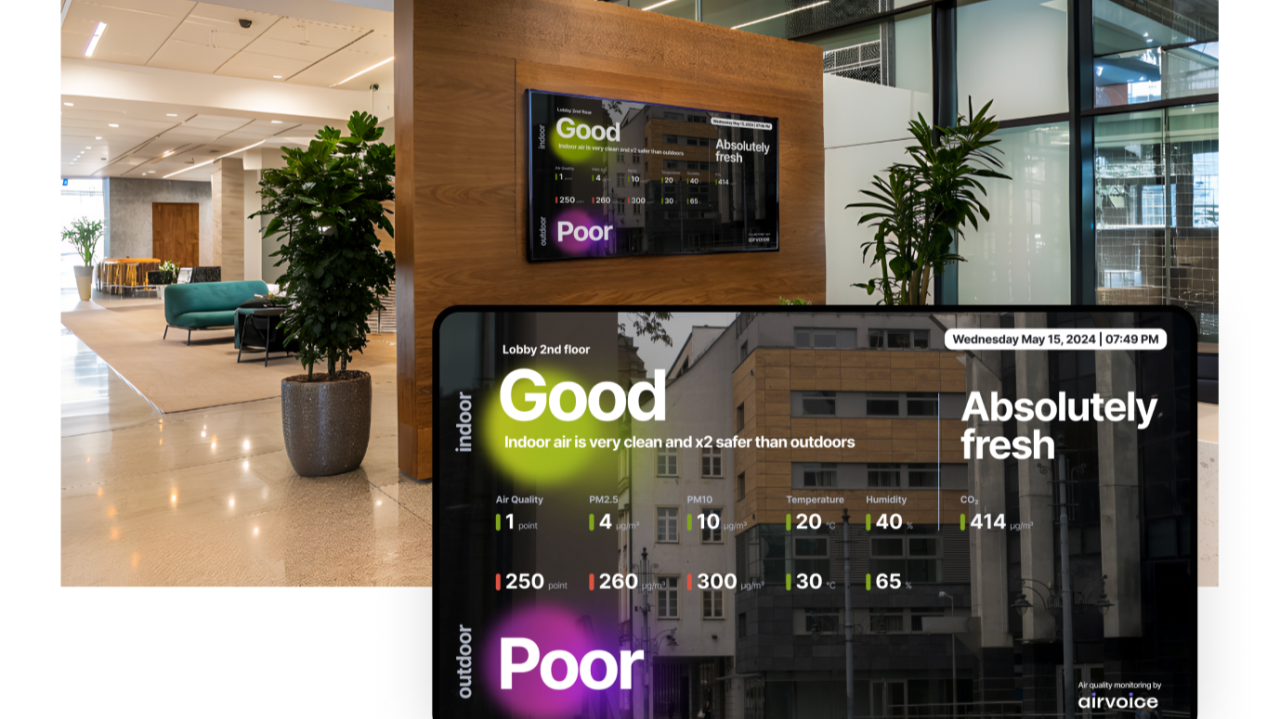
Reports transform measurements into clear, actionable analysis. They present data through structured graphs and statistics, reveal patterns over chosen time periods, and deliver insights that guide decisions. Two report types on the Airvoice.Indoor platform address different needs: Weekly Reports provide building-wide overviews across multiple rooms, while Room Reports deliver detailed analysis of individual spaces over periods from one hour to a full month.
You can generate reports manually whenever needed, or configure Scheduled Reports that deliver automatically to your inbox at your chosen frequency: daily, weekly, or monthly.
You can generate reports manually whenever needed, or configure Scheduled Reports that deliver automatically to your inbox at your chosen frequency: daily, weekly, or monthly.
Weekly Reports: a Clear Overview of Building Conditions
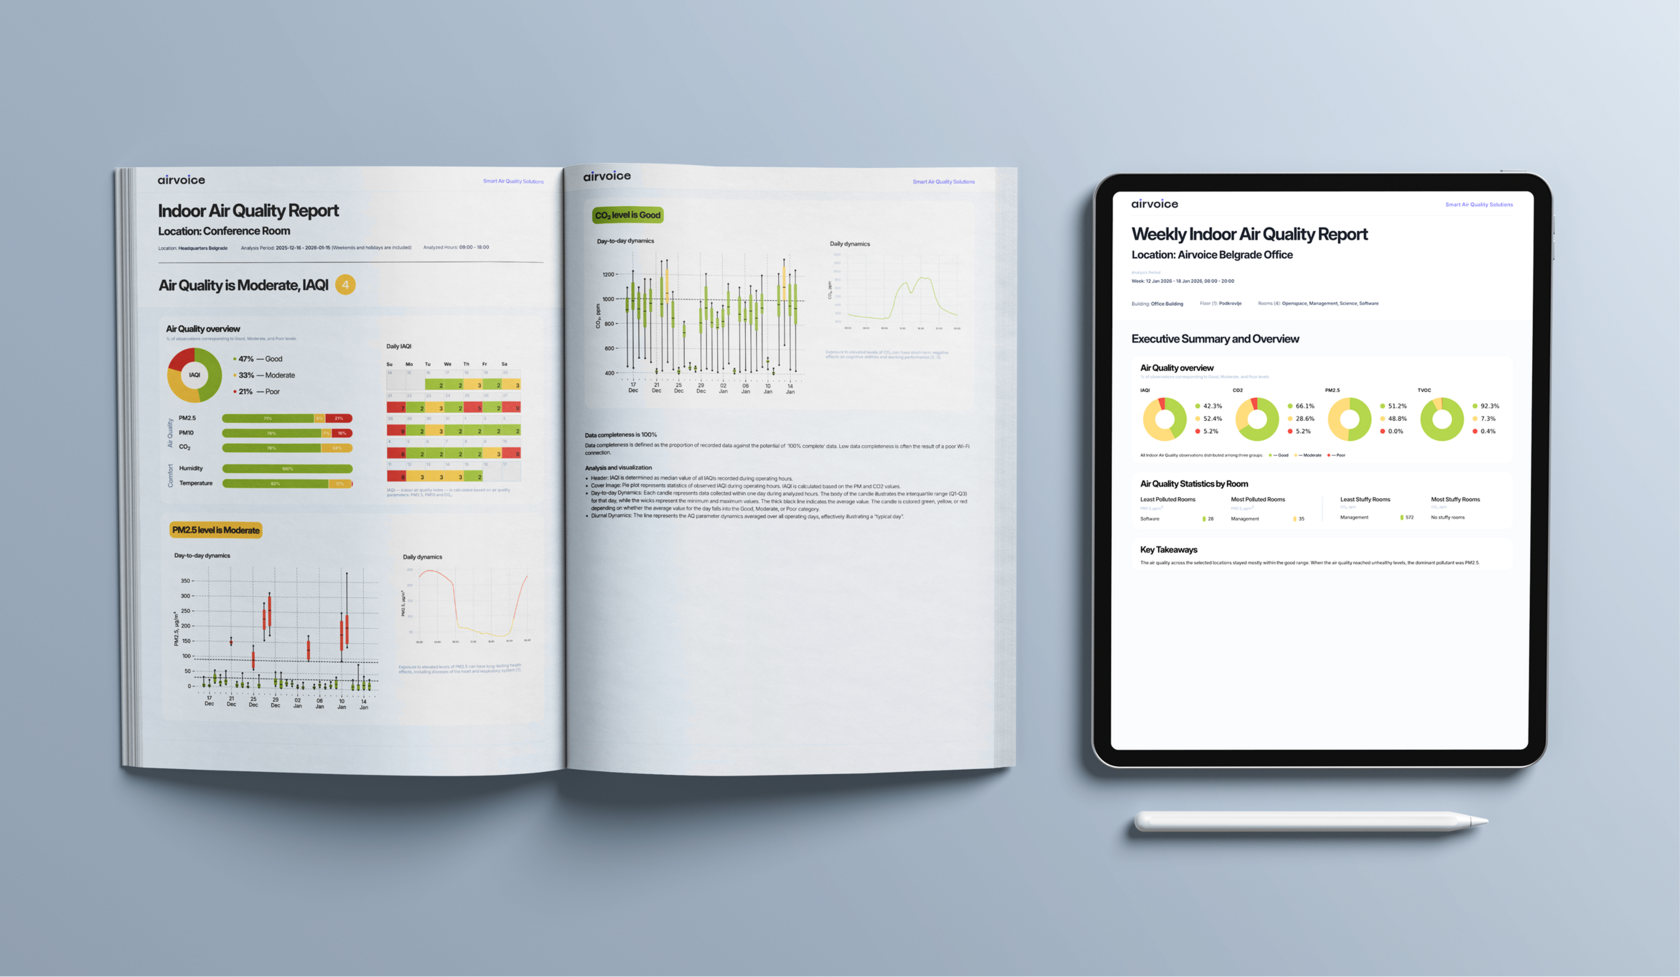
The Weekly Report provides a consistent overview of air quality across multiple rooms in a building. Each report includes:
The output is a structured PDF with your workspace details and branding, ready to share with executives, staff, or ESG auditors.
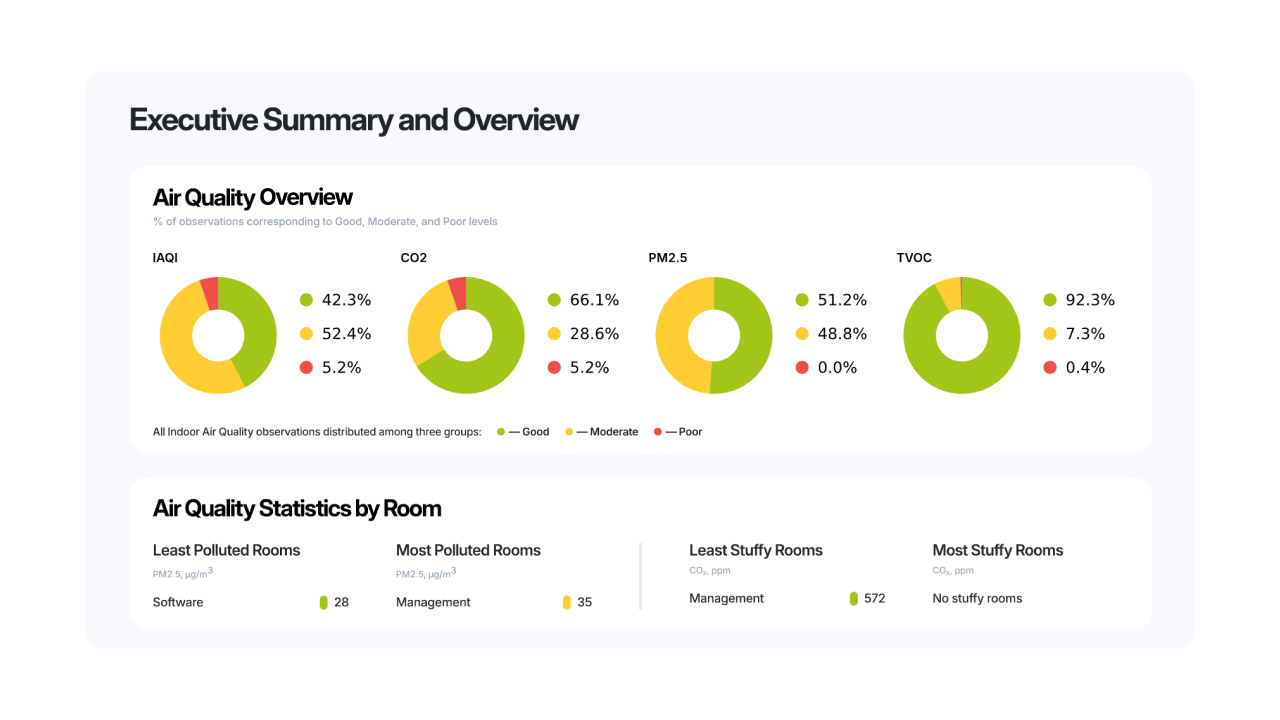
- An Executive Summary with a snapshot of overall indoor conditions
- The share of time spent in good, moderate, or poor IAQI levels for CO₂, PM2.5, and TVOC
- Room statistics highlighting the best- and worst-performing spaces, such as which rooms were most "stuffy" (CO₂) or "polluted" (PM2.5)
- A week-to-week comparison, making it easy to see whether conditions are improving or slipping
The output is a structured PDF with your workspace details and branding, ready to share with executives, staff, or ESG auditors.
Room Reports: Zooming In on a Single Space
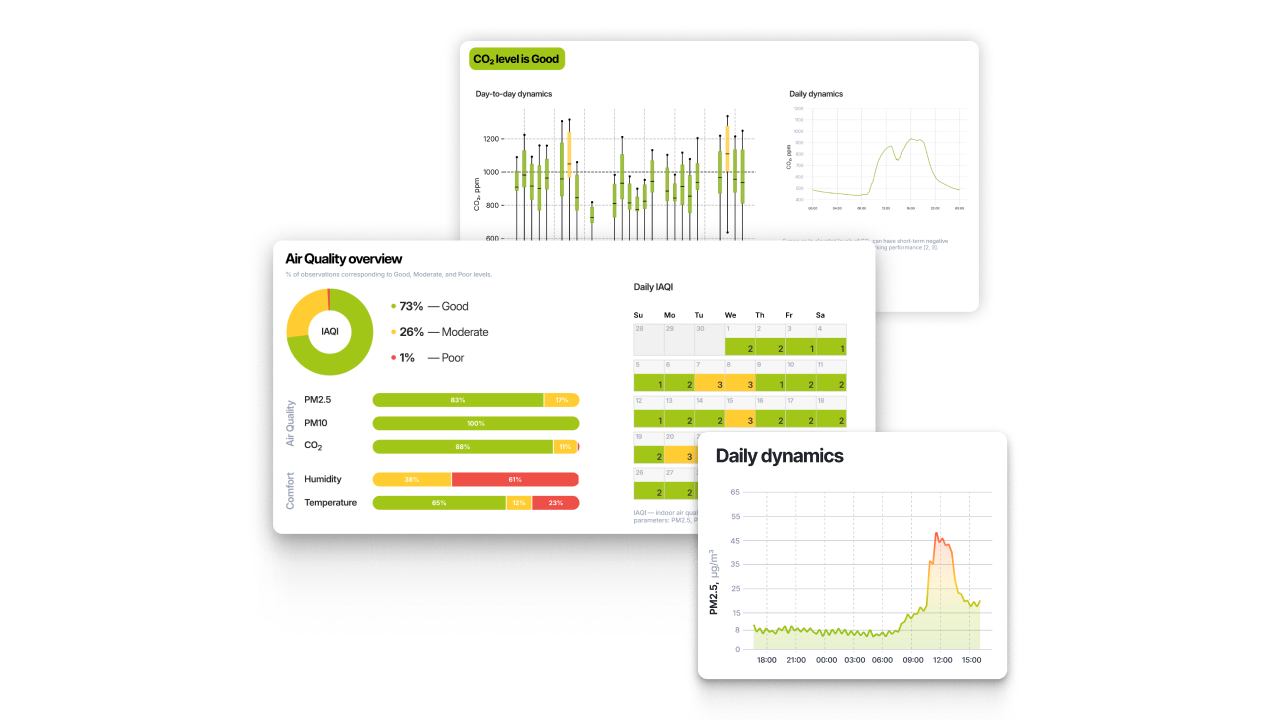
The Room Report examines a single room over a chosen period from one hour up to a full month. Each report includes:
These reports are especially useful when investigating complaints, testing interventions, or studying critical spaces such as meeting rooms or labs.
- Average values for all monitored parameters
- Detailed hourly or daily graphs showing trends
- Data completeness indicators
- Clear conclusions about health and comfort levels
These reports are especially useful when investigating complaints, testing interventions, or studying critical spaces such as meeting rooms or labs.
If you’d like to keep up with our latest case tudies, product launches, and air quality insights, subscribe to our Newsletter. It arrives no more than once every two weeks.
Breathe the difference,
The Airvoice Team
We design software and hardware solutions for monitoring and managing air quality in buildings, industries, and cities, and partner with leading universities worldwide on cutting-edge research.
Breathe the difference,
The Airvoice Team
We design software and hardware solutions for monitoring and managing air quality in buildings, industries, and cities, and partner with leading universities worldwide on cutting-edge research.
Europe: hello@airvoice.global | +359 87 911 36 16
India: namaste@airvoice.global | +91 9205 373 365
USA: hello@airvoice.global | +1 857 639 00 81
India: namaste@airvoice.global | +91 9205 373 365
USA: hello@airvoice.global | +1 857 639 00 81